Journal of Bioscience and Bioengineering Vol. 104, No. 2 (2007)
Vol. 104, August 2007
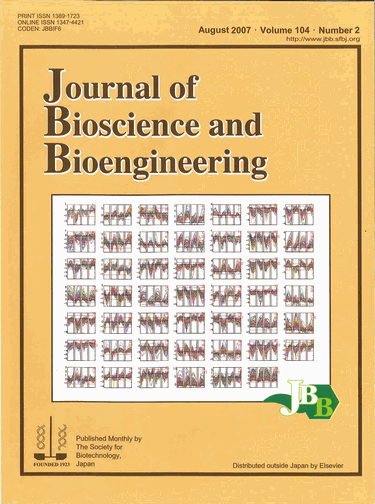
Comparison of gene expression patterns between 0.75 M NaCl and 1 M sorbitol additions in laboratory and brewing strains of yeast using clustering analysis.
Each graph indicates the gene expression patterns of genes in its cluster. The first and second curves in each graph represent the gene expression patterns of the laboratory and brewing strains, respectively, under 0.75 M NaCl addition condition, and the third and forth curves represent those of the laboratory and brewing strains under 1 M sorbitol addition condition. The horizontal axis indicates the time points of the data, and vertical axis indicates the log (base 2) expression ratio. The three horizontal lines represent twofold expression level changes (log22=1 and log21/2=-1) and no change (log21=0). The upper and lower numbers on the right side of each graph represent the cluster number and the number of the genes included in the corresponding cluster, respectively.
Related article: Hirasawa, T., Ashitani, K., Yoshikawa, K., Nagahisa, K., Furusawa, C., Katakura, Y., Shimizu, H., and Shioya, S., “Comparison of transcriptional responses to osmotic stresses induced by NaCl and sorbitol additions in Saccharomyces cerevisiae using DNA microarray“, J. Biosci. Bioeng., vol. 102, 568-571 (2006).
⇒JBBアーカイブ:Vol.107 (2009) ~最新号
⇒JBBアーカイブ:Vol. 93(2002)~Vol. 106(2008)


.gif)